In this document first we will look at the installation and integration of Elk stack and the will explore dockerization.
Elkstack Installation and Integration
ELK stack contains
Elastic Serach, The database
Kibana, the visualization tool
Logstash, the Log Aggregation/collection/ Data Parsing and filtering tool (usually suitable at central log collection, to process the logs posted by filebeats.
Filebeats, The light weight log collection tool (usually suitable at edge devices, just for collecting the logs)
Installation
Download the compiled binaries for the corresponding srchitecture and OS, using the link (this is for x86_64, Linux) https://artifacts.elastic.co/downloads/elasticsearch/elasticsearch-8.4.3-linux-x86_64.tar.gz
Download the compiled binaries for the corresponding srchitecture and OS, using the link (this is for x86_64, Linux) https://artifacts.elastic.co/downloads/kibana/kibana-8.4.3-linux-x86_64.tar.gz
Download the compiled binaries for the corresponding srchitecture and OS, using the link (this is for x86_64, Linux) https://artifacts.elastic.co/downloads/logstash/logstash-8.4.3-linux-x86_64.tar.gz
Download the compiled binaries for the corresponding srchitecture and OS, using the link
Unzip
Unzip all the downloaded tar.gz files using
tar -xvzf elasticsearch-8.4.3-linux-x86_64.tar.gz
tar -xvzf kibana-8.4.3-linux-x86_64.tar.gz
tar -xvzf logstash-8.4.3-linux-x86_64.tar.gz
tar -xvzf filebrat-8.4.3-linux-x86_64.tar.gz
tar -xvzf filebeat-8.4.3-linux-arm64.tar.gz
Start/RUN
To start Elasticsearch
cd <ES_HOME_DIR>
cd ~/elasticsearch-8.4.2-linux-x86_64/elasticsearch-8.4.2
# to start elasticsearch
./bin/elasticsearch
The default port for Elstic Search is port:9200
Note
This will start the elasticsearch defult on localhost with security enabled. Durinthe Initial startup It will generate password for login, default user name is elastic and a token termed as enrollment key for Kibana. Please copy and save it for later use. These dtails will not appear next start up.
Incase if you get any error while running elasticsearch related to JVM heat memory limits, then run the below command
sudo sysctl -w vm.max_map_count=262144
To start Kibana, open another bash
cd <KIBANA_HOME_DIR>
cd ~/kibana-8.4.2-linux-x86_64/kibana-8.4.2
# to start kibana
./bin/kibana
Now open the browser and enter localhost:5601; the defult port for Kibana is port:5601.
It will ask for enrollment key, use the token copied in the previous instance of elasticserach, and click on Enroll.
Once if it is done, it will open a GUI and we will dicsuss more about it later.
Note
Elasticsearch and Kibana will automatically discover each other and requires minimul or no initial configuration
Start Logstash, open another bash
cd <LOGSTASH_HOME_DIR>
cd ~/logstash-8.4.2-linux-x86_64/logstash-8.4.2
Note
Elasticsearch and Logstash will not automatically discover each other and requires some initial configuration for Logstash
Logstash Configuration
Logstash configuration will have 3 parts
Inputs: From where to read the Log files
Filter: processing to be applied on the collected log before forwarding it to the Elasticsearch
Output: Configuration to connect to elasticsearch
Note
Input and Output configuration is must. Filter is optional.
A sample logstash configuration file is given at https://github.com/suresh-iitr/elk-stack/blob/main/logstash/logstash.conf
Logstash can read the filelogs directly or It can collect from filebeat. In our usecase, Logstash, Elastcserach and Kibana are running at VM and the filebeats is running at the edge device. It collects logs and will post to Logstash or the Logstash sitting at VM (central Log Collection and analysis) will collect the logs from multiple Filebeat instances as illustarted in the below figure
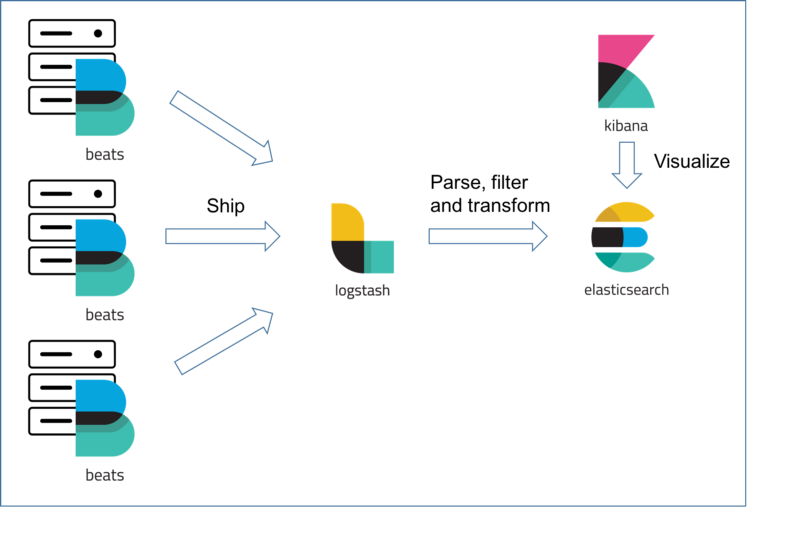
Therefore our input plugin for Logstash is filebeat/beats. The defult fort for Logstash is port:5044. By default it will start on localhost only, and will not accept any external beats connection. To accept at all address use host address as 0.0.0.0
Usually after processing the collected log, It will be indexed to Elasticsearch. Each differnt index will be an identification to seperate the logs comming from different sources. This is where we need to configure output section for Logstash and is typically the address of elasticsearch. As we are running Logstash and Elasticserach on the same host, it would be the local host address 127.0.0.1:9200 or localhost:9200
Index is another important parameter need to specify to identify the logs from different sources. A smple will be index => "test-filebeat-%{+YYYY.MM.dd}". with this indexing the filename index that will appear in Kibana is test-filebeat-2022.10.10
Note
The logstash.conf file should be saved to HOME_DIR of Logstash. It doesn’t necessarly be the same name, we can use differnt name also.
Start Logstash
# to start Logstash
./bin/logstash -f logstash.conf
Starting Filebeat
here we are running two different filebeat instances. One instance in the Raspverry pi (act as Edge device), and the another instance in the same host as that of the Logstash (VM) to collect the logs of it’s own host. Configuration for the both will be same.
cd <FILEBEAT_HOME_DIR>
cd ~/filebeat-8.4.2-linux-x86_64/filebeat-8.4.2
Similar to Logstash Filebeat also require some configuration before starting. The default file is filebeat.yml with some default configurations. We need to edit this as per the usecase.
The filebeat requires two important configurations, 1. Input: What to collect and from where to collect 2. Output: where to send (In our case It would be Logstash)
Inputs in our case would be
1. host specific logs that are stored in /var/log/*.log directory
2. Container logs that are stored in /var/lib/docker/containers/*/*-json.log
Note
To allow the filebeats read access to the docker container logs, Filebeats should be owned by the root user. If you want only the host logs then no need.
A sample filebeat configuration file
filebeat.ymlis given at https://github.com/suresh-iitr/elk-stack/blob/main/filebeat/filebeat.yml
By default in the outputs section elasticsearch would be enabled. Comment out this and uncomment Logstash output section. For the filebeat instance running at Raspi, the host address should be the IP of VM for example 10.12.2.86:5044 where the logstash is running. For the filebeat instance running on the same host as that of logstash, then the host address can be either the IP or the 127.0.0.1:5044 or localhost:5044
# to start filebeat
# first make the filebeat owner as root if you wants to enable the log collection from docker
sudo chown root:root filebeat
sudo chown root:root filebeat.yml
# to test filebeat configuration for errors
./filebeat test config -e

# to start filebeat
./filebeat -e -c filebeat.yml

# Now you shoud see some where in the bash output, that connected to ``10.12.2.86:5044``
Typical Log Locations
for docker
/var/lib/docker/containers/<contsinerID>/<containerID-json.log; Every running docker container instance will create json log for that instance.for Host System
/var/log/
this directory contains various log files like
auth.logrelated to authentication,syslog,boot.logetc..
For NGINX
/var/log/nginx/access.logfor access related and/var/log/nginx/error.logfor access errors related.
Dockerization
The dockerization structure of this whole elk stack is
1. Logstash, Elkstack and Kibana are dockerized at attached to the same docker network, to allow sharing
2. Logstash is exposed to outside at port:5044
3. Elasticsearch is not exposed to outer. Only in the docker network at port:9200
4. Kibana is exposed to outside at port:5061, since we need to access it from outside of the host also.
5. Filebeat is dockerized and allowed to share the Volumes to have access to docker container logs and Host logs. No need to mention any specific port.
create a docker network for sharing among the containers
docker network create esk
Note
The following discussion asumes that, we have the unzipped binary directory for all the elk stack tools that we want to dockerize and they are in a directory elk and the corresponding Dockerfile is saved in the respective directories for each seperately. We alos assume that the configuration files are also available in the respective locations of the directory for each tool if any.
This reference might ne useful https://logz.io/learn/docker-monitoring-elk-stack/
1. ElasticSerach Dockerization:
The dockerfile for the same is available at https://github.com/suresh-iitr/elk-stack/blob/main/elasticsearch/Dockerfile and the Docker Image for the same is available at docker pull suresh-iitr/elasticsearch:latest
We also need to provide some initial configuration file
elasticsearch.ymlhttps://github.com/suresh-iitr/elk-stack/blob/main/elasticsearch/elasticsearch-sample.yml if you want to continue with the default security enabled
build the docker image
docker build -t es:v1 .
Note
while running elasticsearch in docker It will not allow to run as root user. so we need to create a user.
Note
use of seperate command line for changing the ownership will create another copy of the whole file system and the image size will be twice. So It is recommened to execuite the owner ship at the time of COPY it self
COPY --chown=esuser:esuser ./elasticsearch-8.4.2 elasticsearch
Run the Image
docker run -it --user esuser --name es --net esk es:v1 /bin/bash
Initially start the container with default configuration
cd elasticsearch
./bin/elasticsearch
Note
this will start the elastic serach by default with security enabled
To start and attach to a running container
docker start es
docker exec -it es /bin/bash
cd elasticsearch
./bin/elasticsearch
If you want to disable the security then stop the elasticsearch using Ctrl+C and then Copy the condiguration file https://github.com/suresh-iitr/elk-stack/blob/main/elasticsearch/elasticsearch.yml and then restart.
# open another bash
docker cp <SRC> <ContainerID>:<Dest>
docker cp ~/elk/search/elasticsearch.yml 2ea3120be98b:/home/esuser/elasticsearch/config/elasticsearch.yml
# to know container ID run
docker ps -a
# to restart
./bin/elasticsearch
2. Kibana Dockerization:
The dockerfile for the same is available at https://github.com/suresh-iitr/elk-stack/blob/main/kibana/Dockerfile and the Docker Image for the same is available at docker pull suresh-iitr/kibana
We also need to provide some initial configuration file
kibana.ymlhttps://github.com/suresh-iitr/elk-stack/blob/main/kibana/kibana-sample.yml if you want to continue with the default security enabled
Note
with this configuration, we need to have the enroll token, username and password to integrate kibana with Elasticserach If you are using security enabled.
If you want to disable the security then you can use kibana.yml https://github.com/suresh-iitr/elk-stack/blob/main/kibana/kibana.yml
build the docker image
docker build -t kibana:v1 .
# to run Kibana Container
docker run -it --user esuser --name kibana --net esk -p 5601:5601 kibana:v1 /bin/bash
# to start Kibana
cd kibana
./bin/kibana
To start and attach to a running container
docker start kibana
docker exec -it kibana /bin/bash
cd kibana
./bin/kibana
3. Logstash Dockerization:
The dockerfile for the same is available at https://github.com/suresh-iitr/elk-stack/blob/main/logstash/Dockerfile and the Docker Image for the same is available at docker pull suresh-iitr/logstash
We also need to provide some initial configuration file
logstash.confhttps://github.com/suresh-iitr/elk-stack/blob/main/logstash/Samplelogstash.conf if you want to continue with the default security disabledlogstash.confhttps://github.com/suresh-iitr/elk-stack/blob/main/logstash/logstash.conf if you want to continue with the default security enabled
build the docker image
docker build -t logstash:v1 .
# to run logstash Container
docker run -it --user esuser --name logstash --net esk -p 5044:5044 logstash:v1 /bin/bash
# to start Logstash
cd logstash
./bin/logstash -f logstash.conf
To start and attach to a running container
docker start logstash
docker exec -it logstash /bin/bash
cd logstash
./bin/logstash -f logstash.conf
To copy configuration file to running container
docker cp ~/elk/logstash/logstash-8.4.2/logstash.conf a9e3275df951:/home/esuser/logstash/logstash.conf
4. Filebeat Dockerization
The dockerfile for the same is available at https://github.com/suresh-iitr/elk-stack/blob/main/filebeat/Dockerfile and the Docker Image for the same is available at docker pull suresh-iitr/filebeat
A sample configuration file filebeat.yml can be found at https://github.com/suresh-iitr/elk-stack/blob/main/filebeat/filebeat.yml
Inorder to allow the contained flebeat to have access to docker logs as well as host logs we will be using the concept of Docker Volume. we have created two directories in the image of filebeat and will mount to the respective source directories while running the container
# to build Image
# the filebeat should be owned by the root user unlike logstash, elasticsearch and Kibana
docker build -t filebeat:v1 .

# to run the container
docker run -it --name beats -v /var/lib/docker/containers:/dockerlogs -v /var/log:/hostlogs filebeat:v1 /bin/bash

# incase if you are copying filebeat configuration file to a running container, then after copying change the owner permissions for the same
chown root:root filebeat.yml

# to start filebeat
cd filebeat
./filebeat -e -c filebeat.yml
To start and attach to a running container
docker start filebeat
docker exec -it filebeat /bin/bash
cd filebeat
./filebeat -e -c filebeat.yml
To copy configuration file to running container
docker cp ~/elk/filebeat/filebeat-8.4.2-linux-x86_64/filebeat.yml c6fd4998b8c2:/filebeat/filebeat.yml
To copy the certificates, key files use docker cp for the container running on edge device
# for the container running on edge device
docker cp ~/cert/client-pkcs8.key c6fd4998b8c2:/filebeat/client-pkcs8.key
docker cp ~/cert/client.crt c6fd4998b8c2:/filebeat/client.crt
docker cp ~/cert/ca.crt c6fd4998b8c2:/filebeat/ca.crt

#for the container running on host device
docker cp ~/cert/server-pkcs8.key c6fd4998b8c2:/filebeat/server-pkcs8.key
docker cp ~/cert/server.crt c6fd4998b8c2:/filebeat/server.crt
docker cp ~/cert/ca.crt c6fd4998b8c2:/filebeat/ca.crt
Change the ownerships
chown root:root filebeat.yml
chown root:root ca.crt
# edge device
chown root:root client.crt
chown root:root client-pkcs8.key
# Same host device
chown root:root server.crt
chown root:root server-pkcs8.key

# to check for ownership
ls -la
Secure Communication b/w Filebeat & Elastic Search
Till now we have explored about the integration of elasticstack, now we will explore the security acpects.
From every
filebeatinstance represting a signle edge node, to Logstash at VM, the communication should be over HTTPS. The default version isTLSv1.2.From Logstash to Elasticsearch, No TLS is Imposed, Since Elasticsearch is not getting exposed outside.
From Elasticsearch to Kibana also NO TLS is imposed.
Kibana will be exposed to outside so we need to impose TLS.
to use TLS/SSL we need to generate the Certificate and Keys.
Certifcate and Key Generation
Reference: http://www.steves-internet-guide.com/mosquitto-tls/
Overview of Steps 1. Create a CA key pair
openssl genrsa -des3 -out ca.key 2048
# -des3 flag will generate a password protected Key
Create CA certificate and use the CA key from step 1 to sign it.
openssl req -new -x509 -days 1826 -key ca.key -out ca.crt
Create a Server key pair for Logstash Server
don’t password protect
openssl genrsa -out server.key 2048
Create a Server certificate request using key from step 3
openssl req -new -out server.csr -key server.key
Use the CA certificate to sign the Server certificate request from step 4.
openssl x509 -req -in server.csr -CA ca.crt -CAkey ca.key -CAcreateserial -out server.crt -days 360
Create a Client key pair for filebeat instance
don’t password protect
openssl genrsa -out client.key 2048
Create a Client certificate request using key from step 3
openssl req -new -out client.csr -key client.key
Use the CA certificate to sign the Client certificate request from step 7.
openssl x509 -req -in client.csr -CA ca.crt -CAkey ca.key -CAcreateserial -out client.crt -days 360
Now we should have a CA key file, a CA certificate file, a Server key file, A Server Certificate file, Client key file and a client certificate file.
Copy
ca.crt,server.crtandserver.keyto logstash docker instanceCopy
ca.crt,client.crtandclient.keyto filebeat docker instance
Securing the Communication
Ref: https://www.elastic.co/guide/en/beats/filebeat/current/configuring-ssl-logstash.html
Ref: https://www.linode.com/docs/guides/secure-logstash-connections-using-ssl-certificates/
refer to the logstash.conf and filebeat.yml for the configuration changes required for to impose SSL/TLS and also x.509 Certificate based Authentication.
Note
x.509 certificate based authetication will works fine for LAN. But the applicability of the same in external communication is queston mark? since the client certificate will be generated for the private address and the actual public facing address will be different.
Elastic stack supports the keys in pkcs8 format only. to convert the server.key and client.key in to this format use
openssl pkcs8 -in server.key -topk8 -out server-pkcs8.key -nocrypt

openssl pkcs8 -in client.key -topk8 -out client-pkcs8.key -nocrypt
Enable Security in Kibana
To enable security mean SSL/TLS in Kibana since it is getting exposed to outside, add the belllow lines to the kibana.yml file
server.ssl.enabled: true
server.ssl.certificate: "/home/esuser/kibana/config/server.crt"
server.ssl.key: "/home/esuser/kibana/config/server-pkcs8.key"
# these lines by default present in the kibana.yml file with commented out.
# just uncomment them and provide the paths.
Note
It is recommened to save the server.key and server-pkcs8.key in the config directory of kibana
We can ues the same server.crt and server-pkcs8.key generated for Logstash, since both are running on the same host.
To copy the configuration files and the certificates, key files use docker cp
docker cp ~/cert/server-pkcs8.key 32fa520f28c8:/home/esuser/kibana/config/server-pkcs8.key
docker cp ~/cert/server.crt 32fa520f28c8:/home/esuser/kibana/config/server.crt
docker cp ~/elk/kibana/kibana-8.4.2/config/kibana.yml 32fa520f28c8:/home/esuser/kibana/config/kibana.yml
The configuration file with the corresponding changes can be found at https://github.com/suresh-iitr/elk-stack/blob/main/kibana/kibanaSSL.yml
while dockerizing the ELK stack
First start the elsticsearch container with default configfile
docker run -it --name elasticsearch --net elk -p 9200:9200 -p 9300:9300 --user esuser -m 1GB -e "discovery.type=single-node" elasticsearch:8.10.2
with some changes in the default parameters in the elasticsearch.yml file. excluding the security.
Then start the elasticsearch instance: ./elasticsearch/bin/elasticserach
then ctrl+c after token generated
Now make the modifications in elasticserach.yml file to disable the security features make sure all the parameters related to security are set to false
xpack.security.enabled: false

xpack.security.enrollment.enabled: false
xpack.security.http.ssl:
  enabled: true
xpack.security.transport.ssl:
  enabled: false
Then copy this config file to the docker instance
docker cp ~/elasticsearch/elasticsearch.yml elasticsearch:/home/esuser/elasticsearch/config/elasticsearch.yml
then restart the elsticsearch using ./elasticsearch/bin/elasticsearch
Now start the kibana instance
docker run -it --name kibana --net elk -p 5601:5601 --user esuser kibana:8.10.2
in the config file kibana.yml, do the initial modifications
server.port: 5601
server.host: "0.0.0.0"
elasticsearch.hosts: ["http://elasticsearch:9200"]
elasticsearch.ssl.verificationMode: none
These are the major changes to do. copy the modified file to kibana container
docker cp ~/kibana/kibana-8.10.2/config/kibana.yml kibana:/home/esuser/kibana/config/kibana.yml
start the kibana instance using ./kibana/bin/kibana
goto browser and open localhost:5601/
now we can exist from the two containers and then again restart the containers
Logstash is alo started in the same manner as the above
docker run -it --name logstash --user esuser --net elk -p 5044:5044 logstash:8.10.2
things to remember for Logstash is
it requires a logstash.conf file which has to be located in home directory of the logstash
means /home/esuser/logstash/logstash.conf this mainly contains the Input and Output plugin configurations
to run the logstash use /home/esuser/logstash/bin/logstash -f logstash.conf
Filebeats setup.
all the files must be owned by the root user. I could collect the auth.log using the input plugin filestream and providing the path: paths:
/var/log/auth.log
the destination can be Logstash “raspberrypi1.local:5044”
use sudo ./filebeat -e c filebeat.yml to run the filebeat instance
Now we will explore how to collect syslog log using filebeats.
sudo apt list -a rsyslog # to check is rsyslog installed? sudo service rsyslog status # to know the status
This command listed syslog.socket created at /run/systemd/journal/syslog
The example configuration given in Elastic docs
filebeat.inputs:
  - type: syslog
  format: auto
  protocol.unix:
    path: "/path/to/syslog.sock"

sudo ./filebeat test config -e

sudo ./filebeat -e -c filebeat.yml
filebeat.inputs:
 - type: filestream
id: my-filestream-id
enabled: true
paths:
  - /var/log/syslog
tags: [piBeats]

output.console:
enabled: true
pretty: true